

Files
Download Presentation (1.3 MB)
Publication Date
4-2021
Document Type
Presentation
Presentation Type
Individual
Department
Kinesiology and Recreation
Mentor
Michael Torry
Mentor Department
Kinesiology & Recreation
Co-Mentor
Adam Jagondinsky
Co-Mentor Department
Kinesiology & Recreation
Abstract
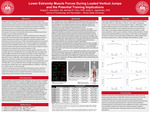
Hexagonal barbell (HB) loaded jumps are often used in training to increase lower extremity power. The effect of external load on lower extremity kinematics and kinetics during jumping has been described, but how individual muscles accommodate to these loads has not. Given the importance of coordinated muscular effort in achieving maximal power output, an understanding of how the lower extremity musculature individually performs during loaded jumps would be advantageous. The purpose of this study is to describe the effect of load on individual muscle forces during the concentric phase of loaded HB jumps. 10 male collegiate athletes (20.4 + 2.4 y; 108.8 + 14.0 kg) performed 5 maximal HB jumps at 0%, 20%, 40% and 60% of their HB deadlift 1-repetition maximum (216.6 + 10.9 kg). Filtered Ground reaction forces (300 Hz) and 3D lower extremity marker trajectories (13 Hz) were input into a 23 DOF musculoskeletal model and muscle forces were estimated with static optimization. Peak muscle force (xBW) was calculated for the gluteus maximum (GMAX), biceps femoris – long head (BFL), rectus femoris (RF), vastus intermedius (VAST), gastrocnemius (GAS), and soleus (SOL). Analysis of variance and LSD post hoc comparisons were used for analysis (p < 0.05). A significant increase in peak muscle force across loads existed for VAST (0%: 7.89 + 0.24 xBW; 20%: 8.22 + 0.28 xBW; 40%: 8.47 + 0.30 xBW; 60%: 8.64 + 0.33 xBW), with significant differences between 0% and 40%, 0% and 60%, and 20% and 60% (all p ≤ 0.015). Significant decreases were noted for RF (0%: 2.50 + 0.13 xBW; 20%: 2.32 + 0.17 xBW; 40%: 2.18 + 0.11 xBW; 60%: 1.98 + 0.20 xBW), with significant differences between 0% and all other conditions, and between 20% and 60% (all p ≤ 0.037). Significant increases were found in GAS across loads (0%: 2.14 + 0.10 xBW; 20%: 2.47 + 0.14 xBW; 40%: 2.72 + 0.12 xBW; 60%: 2.85 + 0.14 xBW), with significance between each load (all p ≤ 0.038). There was no significant difference in GMAX (p = 0.325), BFL (p = 0.369), or SOL (p = 0.122) across loads. Increases in demand were not met with equally distributed increases in peak force output across the lower extremity musculature. The varied effect of load on force output from individual muscles is important information to understand when using loaded jumps as part of training for athletic performance.
Recommended Citation
Salvadore, Abigail, "Lower Extremity Muscle Forces During Loaded Vertical Jumps And The Potential Training Implications" (2021). Kinesiology & Recreation. 3.
https://ir.library.illinoisstate.edu/urs2021knr/3
Notes
Authors: Abigail Salvadore, Michael Torry, Adam Jagondinsky